Listening to communications, downloading weather data from satellites, capturing data from airplanes, SDRs are powerful SIGINT (SIG)nals INT(elligence) devices that are surprisingly cheap and useful. For a great introduction and facts on budget SDRs look at this article. We’re going straight into it.
Basic Tools/ Materials
SDR- For this article I’m using the RTL SDR, which can be found on Amazon, AliExpress, or Ebay. Get the V3 version as the newest V4 doesn’t have 100% compatibility at this time.
Antenna- Any antenna within the signal range of 500 kHz – 1766 MHz will work fine. To see how it works its great if you have a toy, radio antenna, anything that works within the SDR & experimental object you’re using’s frequency range. Ensure the antenna connection type is SMA male. The RTL SDR has an SMA female connector type. For more information concerning antennas, refer to my article
Downloading The Software
Software- There are many SDR software sites you can use. I’m using SDR++ and love it for my Windows and Linux devices. Doesn’t mean its the best, but it’s the best for me.
Once you download the software and unzip it navigate to this site to update the drivers. Below is the figure you want to click on. Unfortunately its ad heavy, but they have to pay the bills somehow (I guess).
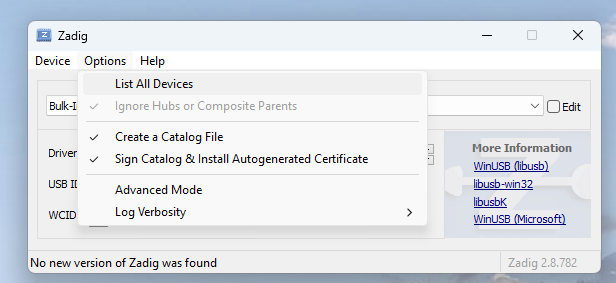
Once Zadig is downloaded go to the “Options” tab and select “List All Devices”
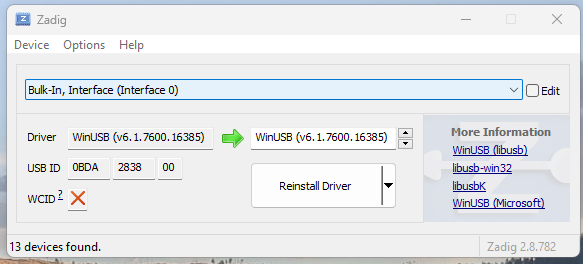
Next, hit the dropdown and select BULK IN, INTERFACE (INTERFACE 0) if you hit ANYTHING else you risk improper updates that will mess up your computer. Select “Install Driver”
Once the download is complete navigate to your unzipped folder and select “sdrpp” (pp means plus plus. I had a great laugh too!)
![]()
Using SDR++ Software
(TLDR: Read the SDR++ Manual)
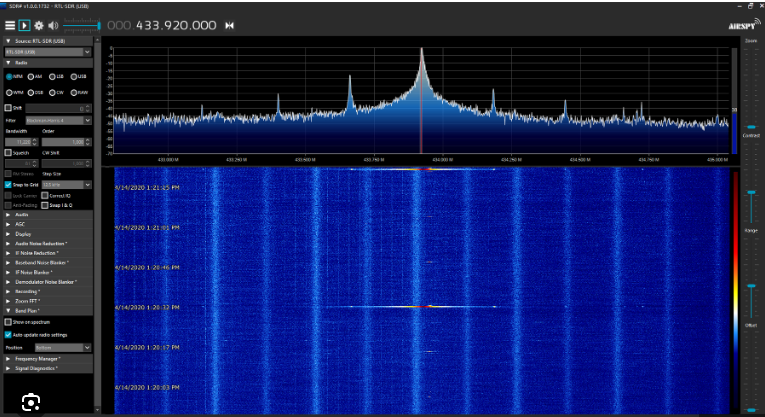
For ease of use we’re gonna break up the SDR++ page into sections using the illustration below as our base reference:
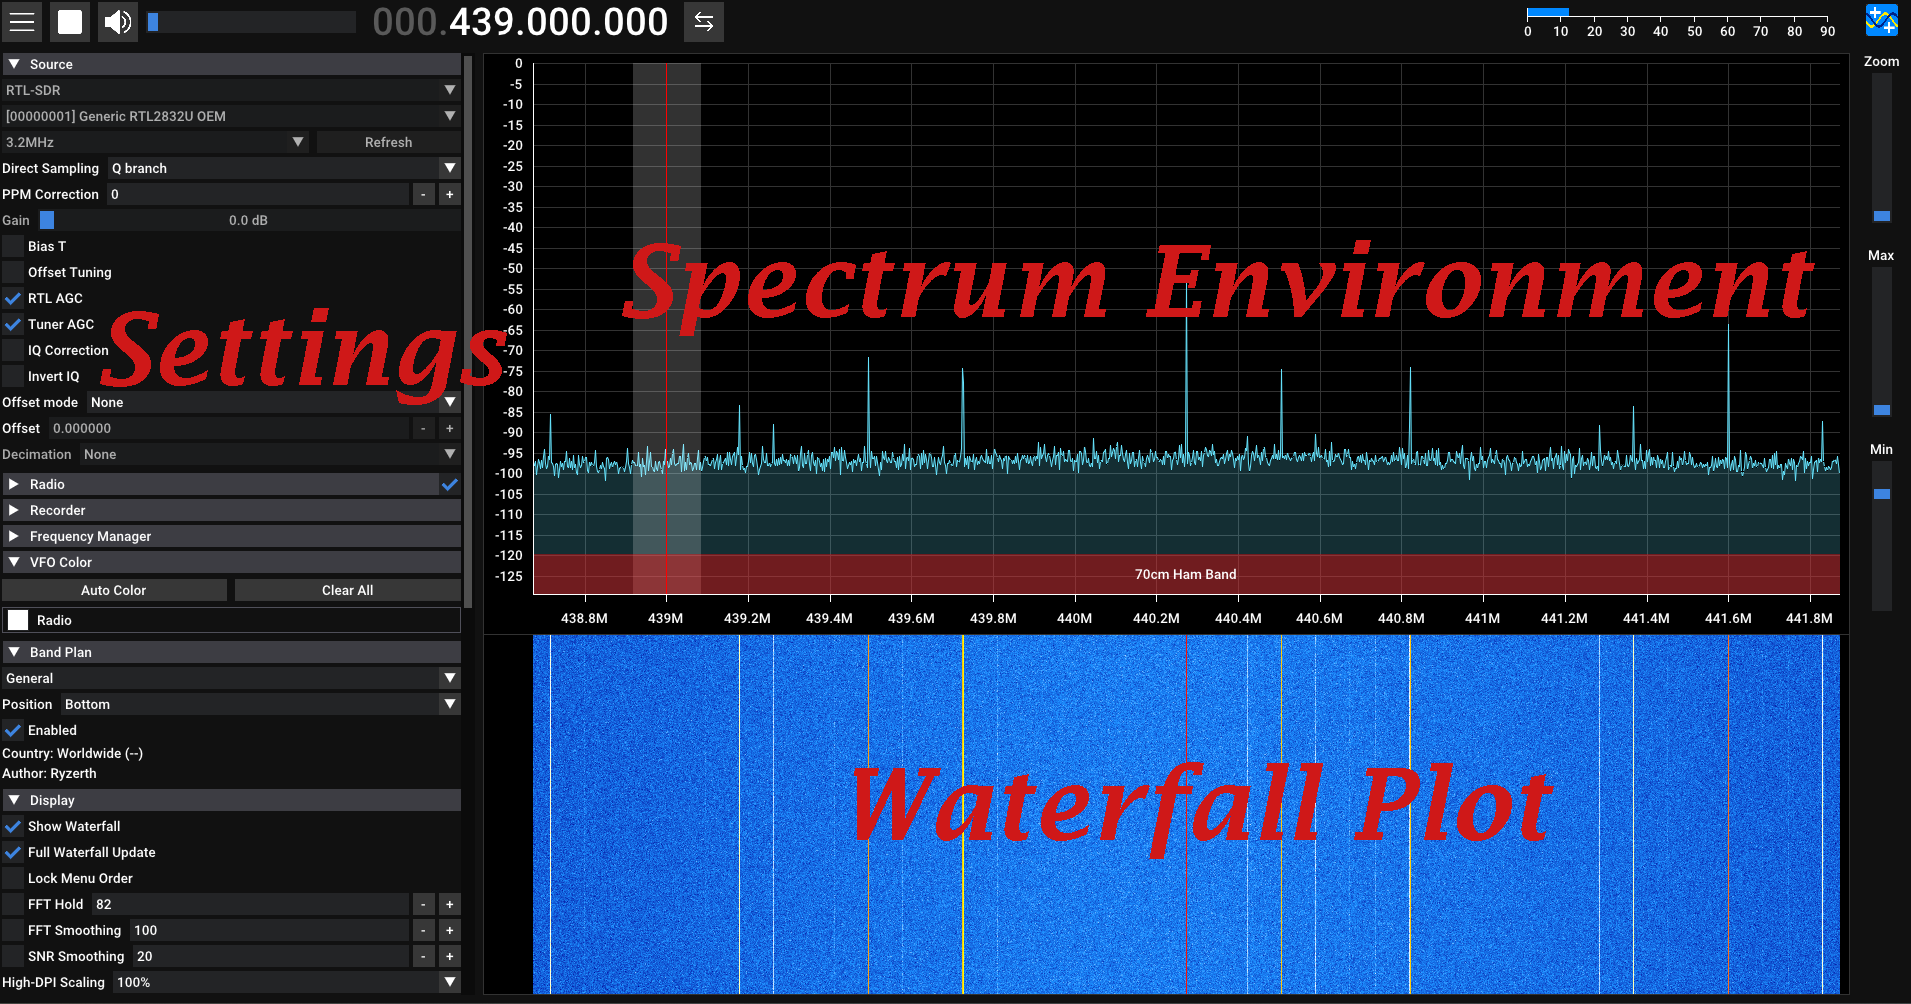
Spectrum Environment & Waterfall Plot
Your spectrum/ signal environment is marked by frequency on your x-axis and power over your y-axis. The higher the frequency the further right along the frequency axis the signal will be placed and the stronger the signal the less negative it will become. Now, all the signal peaks you see all come out of the noise floor, which can be thought of as the background noise in the spectrum. Think of it similarly as the ambient temperature in a room or the background radiation of the universe as it is the collection of all the random and not so random noise in the RF ((R)adio (F)requency) spectrum. There are things that can raise or lower the noise floor such as jammers or band filters but we’ll get to that shortly.
Now, if you want to see a certain frequency you need to have power and access. Access as in is the frequency you’re looking to analyze even online/ available to you and power meaning do you have the antennas with the right dB (decibel) to see the available signal or frequency band? As an aside, frequency bands are frequency ranges that are categorized by their frequency, wavelength, characteristics, and how much data can be carried over said signal. The lower the frequency the farther it can propagate in the atmosphere, but the lower the data rate, while the inverse is true with higher frequency signals. Think of it with cell phone towers. For 4G (4th Generation) cell towers you don’t see them no where near as often as you do 5G (5th Generation) Towers. That’s because 5G towers that work off of frequency range 2 operate within the 24.25 GHz to 52.6 GHz range, while 4G towers operate within the 600 MHz to 2.5 GHz range. Remember, higher frequency, higher amount of data you can put on that signal, less range, meaning more towers.
For the RTL SDR we have default access to the frequency range of.500 kHz- 1766 MHz, but can extend that frequency range down to 300Hz and up to 3100 MHz by using an up converter and down converter respectively. They do exactly what they sound like and take lower or higher frequencies and effectively translate them to a frequency the RTL SDR can see, which we’ll talk about later. Revisiting the SDR++ illustration we can see the large numbers above the signal environment. That tells us the frequency we’re looking at, which is visually seen by the vertical red line in the spectrum environment window. By hovering the mouse over the numbers and manipulating the scroll wheel or by hovering and typing the frequency we can adjust the frequency we observe. Remember that no one antenna can see the full spectrum range, so be sure you look at the antenna’s detailed information to verify it can see the frequencies you’re looking for. As you adjust your view, you’ll see changes in your waterfall plot, which displays frequency power over time. The darker or cooler the waterfall plot or portion thereof the weaker the signal and the hotter it is the higher the power. See below for an example of how changes in power changes the color density of the waterfall plot
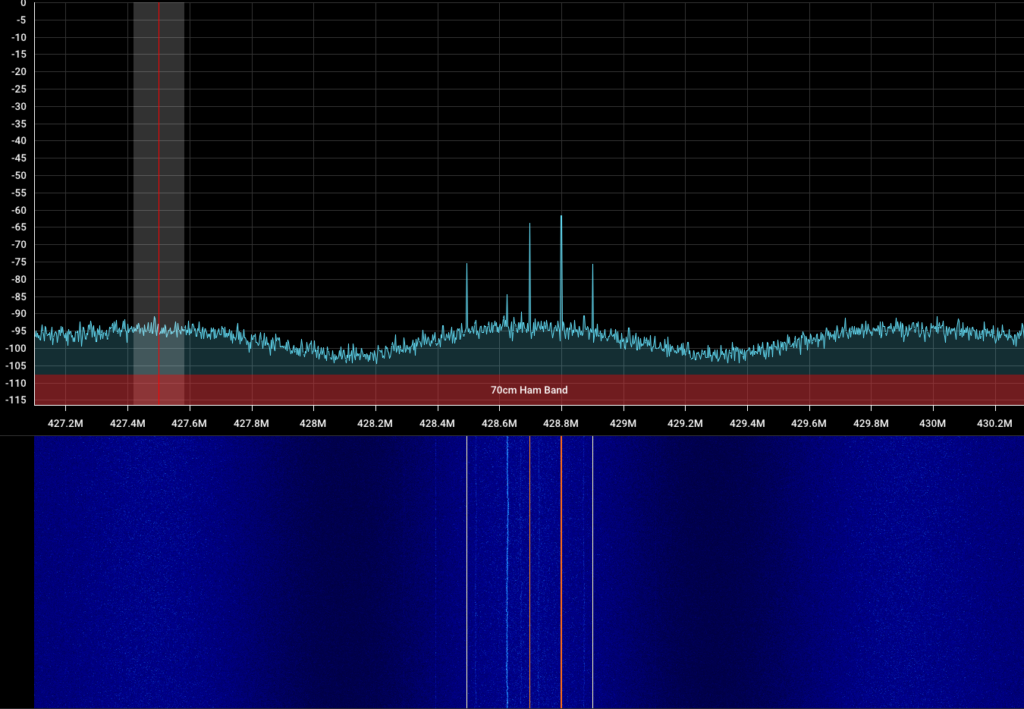
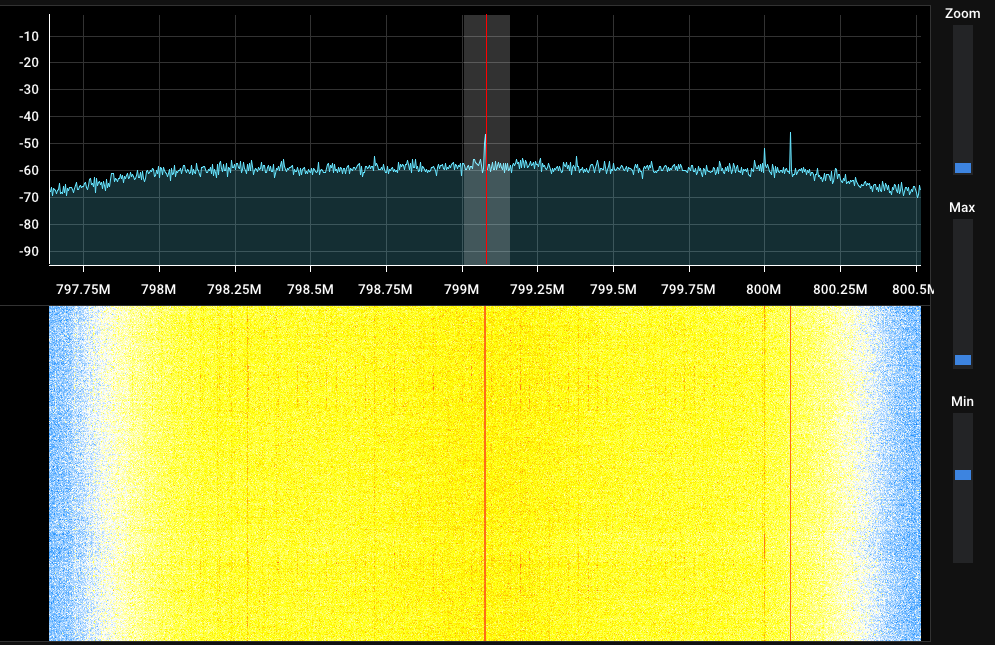
I adjusted the waterfall density by changing the “Min” settings to the right of the waterfall plot, which artificially alters the noise floor level. Does it really alter the noise floor level? No. But does it do it in software? Yes.
Important Controls/ Functions
Zoom: Zooms in the specific frequency you’re looking at. You know what frequency is via the large numbers above the spectrum analyzer and the red vertical line in the spectrum analyzer.
Max: Artificially raises the noise floor and stretches the top of the signal environment.
Min: Opposite of Max.

 Center/ Normal Tuning Mode: These modes alter how you navigate the spectrum environment. Normal tuning mode (opposing arrows) allowing you to freely navigate the spectrum by moving your red FFT frequency line left and right through the spectrum and Center Tuning Mode (target sight) locking the red frequency line in the center of the screen and moving your frequencies around it.
SNR Meter
The SNR meter is the blue gauge in the upper right hand corner of the above picture. SNR stands for (S)ignal to (N)oise (R)atio, and is the difference in power from the peak (top) of a signal to the noise (base) of the overall signal environment. As the signal fluctuates in strength, the SNR meter will adjust in measurement.
Menu Display:
![]() Toggles the visibility of the menu screen. When menu visibility is toggled off, spectrum analyzer and waterfall plot goes into full screen mode.
Toggles the visibility of the menu screen. When menu visibility is toggled off, spectrum analyzer and waterfall plot goes into full screen mode.
Start/Stop Button:
![]() /
/ Starts/ Stops signal processing from the SDR.
Volume Slider:
 Adjusts the volume when listening to voice feeds. Clicking the speaker symbol toggles the mute function.
Menu Settings
Below is the quick fast settings you need to have en/dis-abled when you start up your SDR. Check the manual for additional functionality details. The format will be [Main Menu Header > Setting to adjust/ Adjustment]
Source > Direct Sampling/ Q Branch
Source > Direct RTL AGC (Automatic Gain Control) / Enable Checkbox
Source > Direct Tuner AGC (Automatic Gain Control) / Enable Checkbox
Source > Band Plan/ Enable or Disable at will
Display > Show Waterfall/ Enable
Display > Show Waterfall Update/ Enable or Disable at will
Useful Menu Settings
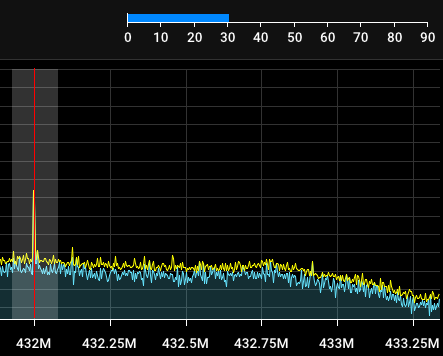
Display > FFT Hold/ The lower the number the slower the signal peaks take to descend. A value of zero makes a max hold where you see the maximum SNR a signal achieved. If you change your frequency and need to refresh your max hold uncheck then recheck the FFT hold.
Recorder > FFT Size/ Adjust– Adjusts the resolution. The higher the number the more detailed the display. May crash if you have an insufficient CPU speeds
Once you’ve setup your SDR, why not use it to track some planes? You may end up tracking Taylor Swift’s plane or maybe you’ll be lucky like me and catch a Qatari government plane leaving Las Vegas! Who knows?